
[ezcol_1half id=”” class=”” style=””]
WHAT IS PRODUCTIVITY RATING?:
PP: Productivity Points (Points, assists, rebounds, steals, blocked shots, FGs made, FTs made added together and then subtracted by missed FGs, missed FTs, personal fouls and turnovers)
MIN: Minutes played overall
PR: Productivity rating per minute played (Productivity points divided by minutes played)
UCLA 75, ARIZONA 71
PRODUCTIVITY RATING
* — STARTERS
[table sort=”desc”]
Player,Pos,PP,MIN,PR
*Nick Johnson,SG,25,39,.641
*Kaleb Tarczewski,C,22,36,.611
Gabe York,SG,12,20,.600
*Aaron Gordon,PF,17,37,.459
*T.J. McConnell,PG,11,32,.344
*Rondae Hollis-Jefferson,SF,9,28,.321
LESS THAN 10 MIN,,,,
Elliott Pitts,SG,3,5,.600
Jordin Mayes,PG,0,3,.000
TOTAL TEAM,,99,200,.495
[/table]
[/ezcol_1half]
[ezcol_1half_end id=”” class=”” style=””]
My colleague and friend Anthony Gimino, a longtime Tucson sports journalist, noticed last night that Arizona’s free-throw shooting percentage is 65.5 percent.
“Did you know that’s the same as the championship team in 1996-97?” he asked.

Mike Bibby was one miss away from shooting below 70 percent from the free throw line in Arizona’s championship season of 1996-97
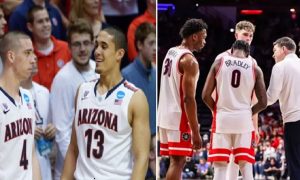
Get out. No way. That team had Michael Dickerson, Mike Bibby and Miles Simon, all of whom defined grace under pressure. Those guys could shoot with their eyes closed.
I covered that team for The Arizona Daily Star. I must admit that I do not recall a free-throw percentage of only 65.5 percent. I had to Google it. Sure enough, Arizona’s percentage from the line in 1996-97 was exactly 65.5 percent in the Wildcats’ 34 games (Arizona finished 25-9 that season).
Arizona’s game total to this point: 34 games.
The Wildcats made 598 out of 913 attempts from the line in 1996-97. They are 520 of 794 this season.
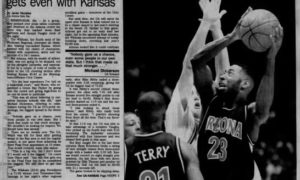
Dickerson, Simon, Bibby and Jason Terry combined to make 377 out of 524 attempts, a respectable (but still questionable) 71.9 percent. None of them eclipsed 80 percent despite being solid shooters. Simon led the team shooting 75.4 percent. Bibby, believe it or not, was one miss from finishing below 70 percent. He made 89 of 127 attempts, good for 70.1 percent.
The free-throw shooting percentage from the rest of the team in 1996-97: 56.8 percent.
[/ezcol_1half_end]
[ezcol_1half]
TOP FIVE ARIZONA REBOUNDING TEAMS
[table=”desc”]
Margin,Team,Avg,Opp,Games
19.3,1950-51,59.5,40.2,30
9.7,1976-77,46.7,37.0,27
8.5,2013-14,38.9,30.4,34
8.3,1975-76,47.2,38.9,33
8.1,1998-99,41.7,33.6,29
[/table]
Similar to Arizona this season, the Wildcats made up for their free-throw shooting deficiencies 17 years ago in other areas. The most obvious was ball movement and creating fast break opportunities off of steals. The Wildcats had two players with at least 150 assists — Bibby with a team-high 178 and Terry with 150. The Wildcats also had 358 steals in 1996-97 (Arizona has 200 this season), which fueled their transition offense.
Arizona averaged 83.8 points a game in its title season. The Wildcats average 73.1 this season.
The Wildcats are highly efficient with their defense and rebounding this season.
Wow !! Nick Johnson from Aaron Gordon. Gotta be a top ten highlight !#FunToWatch
— Rich Rodriguez (@CoachRodAZ) March 15, 2014
Opponents are averaging only 58.1 points a game and shooting 38.1 percent from the field. Arizona has limited opponents to a percentage of only 31.4 from three-point range.
Arizona is outrebounding opponents by an average margin of 8.5 a game, which ranks as the third-best in school history.
In 1996-97, opponents averaged 73.3 points a game and shot 43.6 percent from the field. Opponents made only 32.8 percent from three-point range, similar to Arizona’s defensive effort beyond the arc this season.
Arizona outrebounded opponents by an average margin of 2.3 a game 17 years ago.
On free throws, the lineup change, those looong conference road trips and other postgame notes from Las Vegas: http://t.co/JOVhwxvp76
— Bruce Pascoe (@BrucePascoe) March 16, 2014
Nick Johnson, Brandon Ashley and Kaleb Tarczewski are the only Wildcats this year shooting better than 70 percent from the free-throw line. Johnson leads the team at 76.9 percent, followed by Tarczewski (75.8) and Ashley (75.7). This is one area in which the Wildcats miss Ashley, who could draw fouls playing inside banging for rebounds and trying to shoot over defenders near the hoop.
The mystery this season: Guards T.J. McConnell and Gabe York combining to shoot only 66.3 percent from the line. They have each tried 43 free throws. McConnell has made 27 and York 30. McConnell made 83.6 percent of his free throws as a sophomore at Duquesne in 2011-12.
Aaron Gordon is making only 43.5 percent of his free throws, but he has a history of problems at the line.
Raw emotion all over Aaron Gordon's face in locker room. It's simple why he took the loss so hard: "I hate losing," he said.
— Anthony Gimino (@AGWildcatReport) March 16, 2014
Playing for Team USA in the Under-16 World Championship three years ago he made only 3 of 16 free-throw attempts (18.8 percent). Last year for the Under-19 team Gordon made 9 of 17 free throw attempts (52.9 percent).
Gordon makes up for the deficiency in other areas with his defense and rebounding (7.8 a game) and ability in the open court. He had eight assists with only one turnover in 37 minutes against UCLA yesterday.
As is the case with every team every year, you must take the good with the bad. The problem with the “bad” in Arizona’s case is that missed free throws are magnified in close games, such as the loss to the Bruins.
The 1996-97 team overcame the deficiency by going all the way for the title. Arizona will try to take what they can at the free-throw line and go from there starting most likely Friday in the NCAA tournament.
[/ezcol_1half]
[ezcol_1half_end id=”” class=”” style=””]
PAC-12 RPI (ESPN.com)
[table=”desc”]
RPI,Team,D1 W-L,SOS,1-50
2,Arizona,30-4,5,11-3
14,UCLA,26-8,16,8-5
27,Oregon,23-9,18,4-6
32,Colorado,23-11,15,5-8
40,Stanford,21-12,19,5-9
44,Arizona St.,21-11,58,4-7
61,California,19-13,42,4-10
81,Utah,19-11,104,4-8
101,Washington,17-15,61,4-7
103,Oregon St.,16-15,71,4-7
171,USC,10-21,41,2-12
219,Washington St.,9-21,67,1-11
[/table]
ARIZONA OVERALL PRODUCTIVITY RATING
[table sort=”desc”]
Player,Pos,G,S,PP,MIN,PR
Nick Johnson,SG,34,34,757,1104,.686
Brandon Ashley,PF,22,22,371,609,.609
Aaron Gordon,SF,34,34,639,1052,.607
Kaleb Tarczewski,C,32,31,541,909,.595
R. Hollis-Jefferson,SF,34,6,493,851,.579
T.J. McConnell,PG,34,34,527,1084,.486
Gabe York,SG,34,8,277,717,.386
AVG 5-9.9 MIN,,,,,,
Jordin Mayes,PG,30,1,41,167,.246
Elliott Pitts,SG,20,0,35,176,.199
AVG 1-4.9 MIN,,,,,,
Chris Johnson,PF,4,0,5,6,.833
Jacob Hazzard,PG,12,0,21,28,.750
Matt Korcheck,PF,20,0,47,90,.522
Erik Conklin,F,7,0,6,17,.353
Trey Mason,SG,10,0,7,22,.318
Drew Mellon,F,6,0,2,12,.167
Zach Peters,C,10,0,-6,29,-.207
TOTAL TEAM,,,,3682,6875,.536
[/table]
ARIZONA PAC-10/12
PLAYERS OF THE YEAR:
[table sort=”desc”]
Name (Year),G,S,PP,MIN,PR
Derrick Williams (2011),38,38,1190,1141,1.043
Sean Elliott (1989),33,33,1128,1125,1.003
Chris Mills (1993),28,28,838,870,.963
Sean Elliott (1988),38,38,1167,1249,.934
D. Stoudamire (1995),30,30,964,1092,.883
Mike Bibby (1998),35,35,905,1124,.805
Jason Terry (1999),29,29,877,1107,.792
Nick Johnson (2014),34,34,757,1104,.686
[/table]
NICK JOHNSON CAREER POINTS RANKING
[table=”desc”]
Rank,Player,Years,Points
25,Mustafa Shakur,2004-07,1318
26,Ivan Radenovic,2004-07,1300
27,Nic Wise,2007-10),1285
28,Nick Johnson,2011-14,1267
29,Link Richmond,1944-49,1246
30,Derrick Williams,2009-11,1227
[/table]
[/ezcol_1half_end]
ARIZONA SCHEDULE/PRODUCTIVITY RESULTS
[table sort=”desc”]
Date,Opponent,Results,TeamPR,Productivity Leader,Pos,PP,MIN,PR
March 15,UCLA,75-71 (L),.495,Nick Johnson,SG,25,39,.641
March 14,Colorado,63-43 (W),.505,Rondae Hollis-Jefferson,SF,23,28,.821
March 13,Utah,71-39 (W),.565,Nick Johnson,SG,23,26,.885
March 8,@Oregon,64-57 (L),.380,Aaron Gordon,PF,28,33,.848
March 5,@Oregon St.,74-69 (W),.470,Nick Johnson,SG,35,33,1.061
March 2,Stanford,79-66 (W),.605,Aaron Gordon,SF,39,32,1.219
Feb. 27,California,87-59 (W),.730,Nick Johnson,SG,38,31,1.226
Feb. 22,@Colorado,88-61 (W),.720,Aaron Gordon,PF,35,27,1.296
Feb. 19,@Utah,67-63 OT (W),.391,Gabe York,SG,20,36,.556
Feb. 14,@ASU,69-66 2OT (L),.356,Kaleb Tarczewski,C,22,45,.489
Feb. 9,Oregon St.,76-54 (W),.575,T.J. McConnell,PG,25,30,.833
Feb. 6,Oregon,67-65 (W),.455,Rondae Hollis-Jefferson,SF,31,34,.912
Feb. 1,@California,60-58 (L),.430,Kaleb Tarczewski,C,34,35,.971
Jan. 29,@Stanford,60-57 (W),.400,Nick Johnson,SG,24,33,.727
Jan. 26,Utah,65-56 (W),.435,Rondae Hollis-Jefferson,SF,16,24,.667
Jan. 23,Colorado,69-57 (W),.525,Brandon Ashley,PF,24,31,.774
Jan. 16,ASU,91-68 (W),.675,Nick Johnson,SG,23,27,.852
Jan. 12,@USC,73-53 (W),.520,Brandon Ashley,PF,28,31,.903
Jan. 9,@UCLA,79-75 (W),.570,Gabe York,SG,16,18,.889
Jan. 4,Washington,71-62 (W),.580,Nick Johnson,SG,34,36,.944
Jan. 2,Washington St.,60-25 (W),.510,Kaleb Tarczewski,C,20,22,.909
Dec. 23,NAU,77-44 (W),.660,Rondae Hollis-Jefferson,SF,30,27,1.111
Dec. 19,Southern,69-43 (W),.535,Aaron Gordon,SF,28,29,.966
Dec. 14,@Michigan,72-70 (W),.530,Kaleb Tarczewski,C,23,26,.885
Dec. 11,N.M. State,74-48 (W),.555,Rondae Hollis-Jefferson,SF,22,23,.957
Dec. 7,UNLV,63-58 (W),.450,T.J. McConnell,PG,29,35,.829
Dec. 3,Texas Tech,79-58 (W),.570,Brandon Ashley,PF,32,28,1.143
Nov. 29,Duke,72-66 (W),.590,Kaleb Tarczewski,C,21,28,.750
Nov. 27,Drexel,66-62 (W),.505,Nick Johnson,SG,31,36,.861
Nov. 19,Rhode Island,87-59 (W),.685,Nick Johnson,SG,39,26,1.500
Nov. 18,Fairleigh Dickinson,100-50 (W),.890,Nick Johnson,SG,30,20,1.500
Nov. 14,@San Diego State,69-60 (W),.490,Nick Johnson,SG,29,31,.935
Nov. 11,Long Beach State,91-57 (W),.790,Brandon Ashley,PF,28,21,1.333
Nov. 8,Cal Poly,73-62 (W),.565,Rondae Hollis-Jefferson,SF,20,21,.952
[/table]
ALLSPORTSTUCSON.com publisher, writer and editor Javier Morales is a former Arizona Press Club award winner. He also writes articles for Bleacher Report and Lindy’s College Sports.
[rps-paypal]
|
|














Recommended for you